FS25 Data Acquisition and Communications System
FS25 Data Acquisition and Communications System#
-
This year I joined my university’s Formula Student Internal Combustion (IC) Electrics team. I’d been wanting to join for a while but since I was on my placement year I saw it as an opportunity to remain in touch with university in my time away.
-
The basic goals of the project were as follows:
-
- Design a system capable of compiling data from the car into a dashboard-style UI to mount on the steering wheel so that the driver can remain informed of speed, RPM and other telemetry.
-
- Design a PCB to mount atop the Raspberry Pi base to enable this functionality in a compact package.
-
- Design networking capability over cellular internet as well as the required software suite such that a team member (me) on the pit wall can remotely monitor the car in real time.
-
-
As such, the project can be evenly split into five sectors: Hardware, Data Acquisition, Driver Display, Networking and Pitwall Software.
Hardware#
-
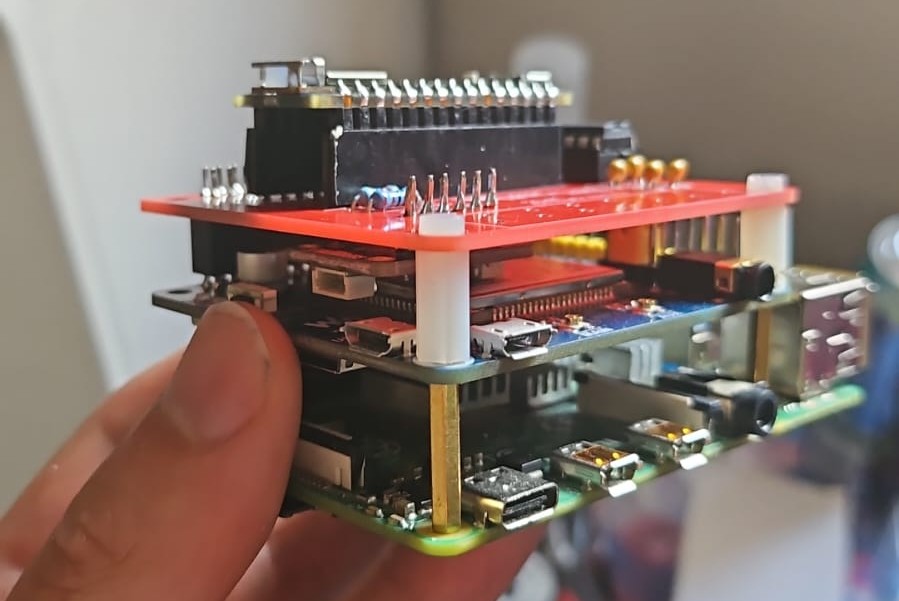
We immediately settled on using a Raspberry Pi 4B for this as our base. I have a lot of experience working with similar hardware so for a first-generation version of this sustem we thought it would be a good starting point. In the future we hope to move to a more embedded-system architecture to save space.
- We immediately purchased a few parts - a 3.5-inch SPI screen to mount to the steering wheel (chosen for its minimal wire requirement), an Arduino Nano (to read Analogue values since the Pi has no analogue pins, also for its on-board IMU), an Adafruit BNO055 dedicated IMU board and an RS232 serial reading chip for communication with the ECU.
- We also bought the Waveshare 7600X 4G HAT to handle our 4G networking and GPS.
-
After setting up the custom GPIO configuration for the Pi so that it could communicate with all these components simultaneously, we set about designing a PCB that would house all our additional parts and sit on the top layer of the circuit sandwich forming. This went about multiple revisions but the final result was exactly what we needed.
Data Acquisition#
-
With the hardware decided and development on the PCB beginning I turned my focus to the data I would be compiling. The final list ended up being the following:
- SIM7600X:
- Reports GPS Coordinates
- RS232 (ECU):
- Engine RPM
- Engine Temp
- Throttle Position
- Arduino Analogue Pins:
- Wheel Speed
- Killswitch indicator
- Neutral flag
- BNO055 IMU:
- Acceleration
- Temperature on-board
- Gyroscope measurements
- SIM7600X:
-
Important Note - it may seem as if I have forgotten Gear Position - rest assured I have not! I calculate that value using the gear ratios given to me by Drivetrain. Not a perfect solution but we lack a Gear Position Sensor currently.
-
The main point of difficulty with this stage was interpreting signals from all the sensors and signals. Given the lack of documentation on many of these, it took a lot of trial, error and testing. Especially for the ECU. There was zero publicly available documentation on the format or structure or protocol of the transmitted data so, based on some sketchy form I found online, I reverse-engineered the protocols and was able to extract anything from the dataset the ECU was providing.
Communications#
-
A major aspect I wanted to work on with this system was the ability to communicate in real time with the pitwall. To this end, we chose the SIM7600X not just for its GPS capabilities but because it provides 4G networking with a SIM card slot, connected over a UART channel. With some minimal setup, we can connect to the internet wherever we are as long as there is phone signal.
-
Naturally, cellular networking like this poses some issues for connectivity. Namely, non-static IP addresses and port forwarding issues. To solve this, I implemented a service called ngrok which allows me to tunnel through a defined address and port regardless of the connection status of the Pi. This address would be shown on the UI when networking is active such that the pitwall software can connect to it and begin recieving streamed data.
-
As such, I then built the client (pitwall) software. The outgoing data packets were structured in such a way that the data could be dynamically interpreted, logged and displayed accurately (each datapoint has a label and a value). As such, the client was built to search for specific data labels and display a few of them in a dedicated UI with the rest accessible through each data point. After connecting, the client displays the following:
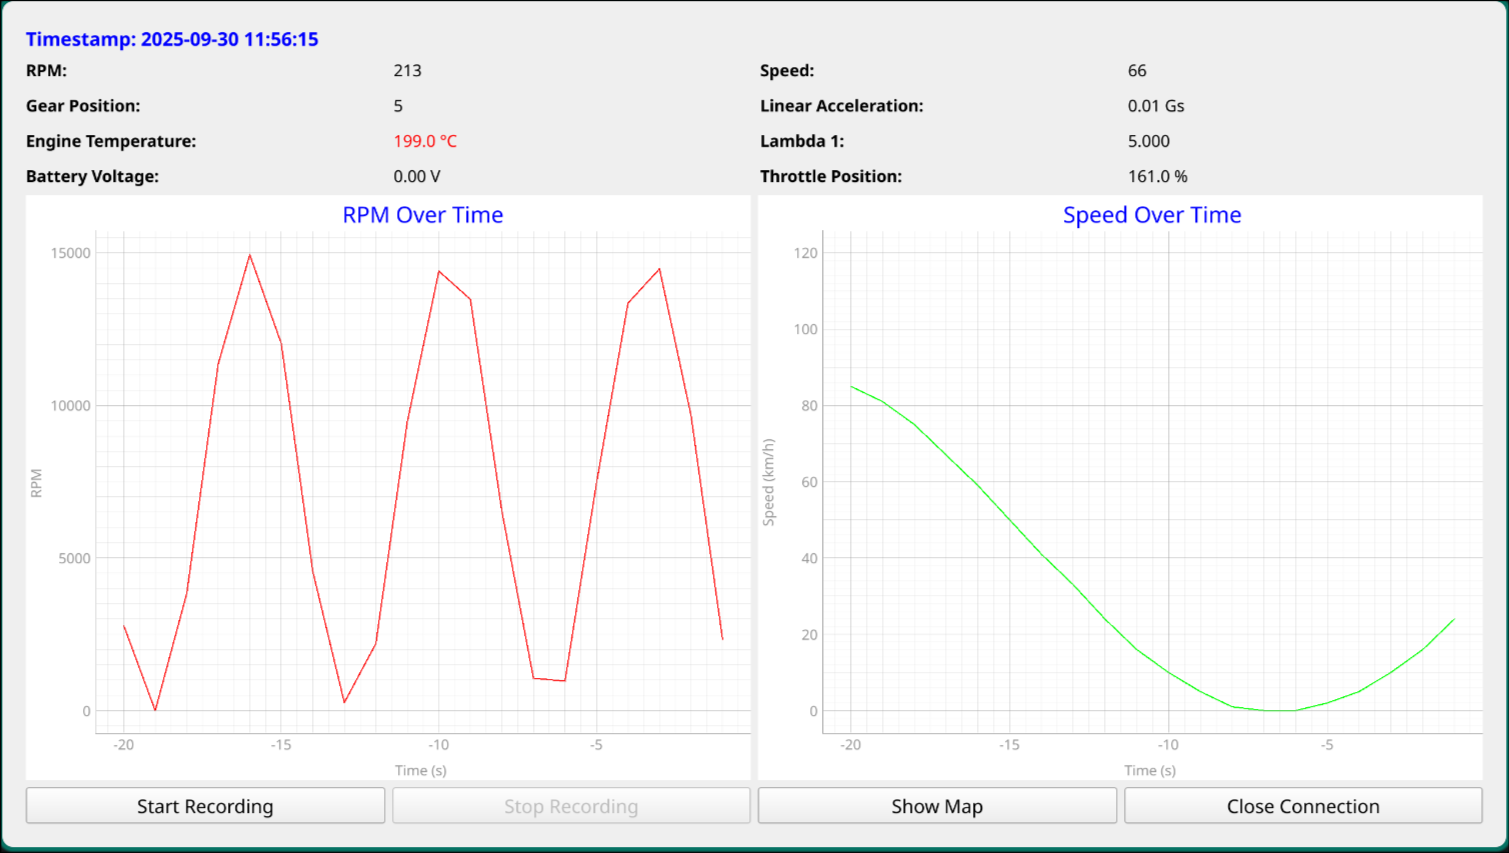
- As you can see, there are two graphs displaying RPM and Speed as well as a few parameters displayed above for easy tracking. You can also press a button to view all the data in the packet or the GPS location rendered dynamically in a map window. You may also notice that there is a button to Start and Stop recording data - this ties into the other piece of software I built, the Analyzer. The client can record data to a CSV file which will then be picked up and read by another program.
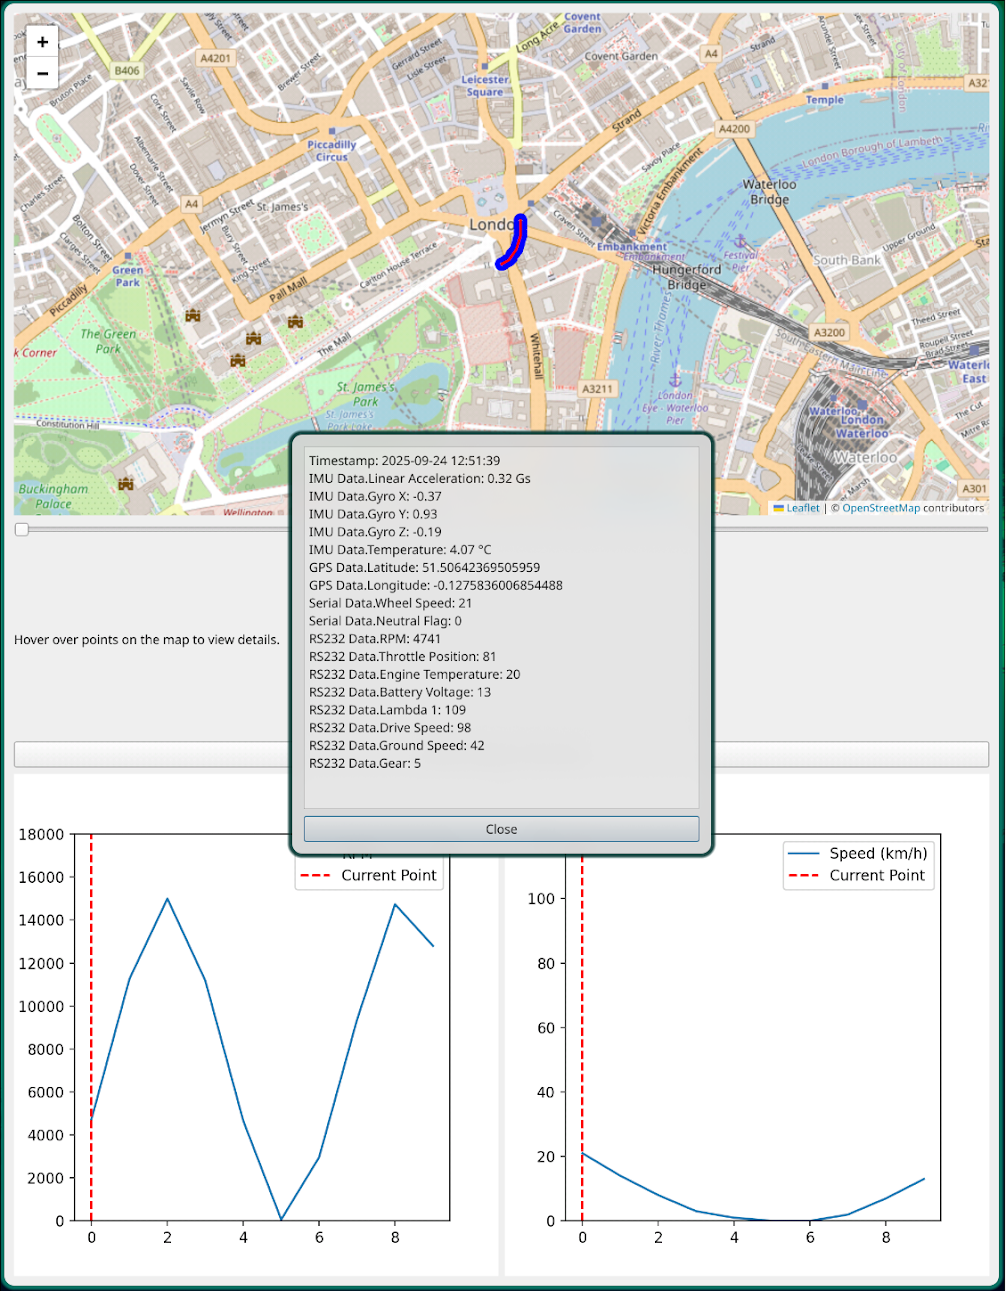
- The Analyzer is a simple and easy way to read the data recorded by the Client. It displays all datapoints recorded in their GPS positions and displays the same relevant data as the Client immediately. You can then scroll through the recorded datapoints in time order, so that you can review specific datapoints at specific points of track, for example.
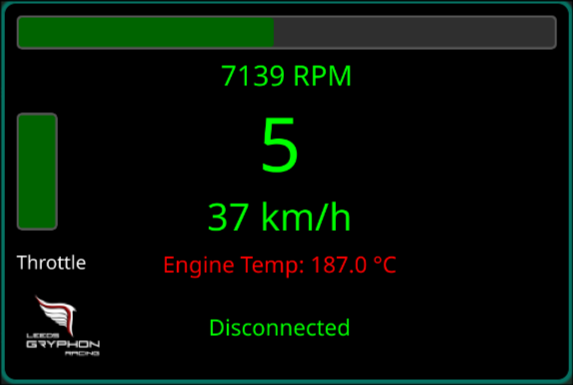
Graphical User Interface#
- The GUI that runs on the Server is intended to be placed on the dashboard or steering wheel of the car. As such it contains essential information for the driver as well as connection information for the client. The design of this UI went through many iterations through collaboration with team-mates and was inspired by existing motorsport mounted dashboard layouts.
Parallelizing#
-
To run all of this on the Pi without hangups from sensors and so on, I enlisted a parallel processing library in Python. I gathered the three main functions of the server into the three main groups and designed three “threads” in accordance that would run independantly of each other.
-
That said, within each thread there came some issues to address to ensure responsiveness and reliability - namely the RS232 data stream and the GPS data stream. These often caused hangups in the data collection thread and thus were split out into their own threads so that if there was a delay in response to either of these sources, the rest of the telemetry did not suffer as a result. In the case of a hangup anywhere, a cached “previous value” would be given to the latest data packet instead.
The repository for this project can be found here.